1. Expected Goals (xG) is a statistical metric that assigns a probability value between 0 and 1 to every shot, indicating the likelihood of it resulting in a goal based on factors such as distance and angle to the goal, type of play (open play, set piece, penalty, one-on-one), body part used for the shot, quality and type of assist, position and pressure from defenders, position of the goalkeeper, shot height and direction, etc. As a result, the xG for each team is calculated, which allows us to assess how much the scoreboard score corresponds to the actual quality of the game moments created.
In other words, statistical systems (e.g. Opta Sports, Statsbomb and others) calculate the probability of an expected goal in the current specific situation on the football pitch when the kick is taken. In simplistic terms, the statistical system knows that given the current position of the players on the pitch, the current distance to the goal, the current position of the opposing team’s goalkeeper, the current weather, given which part of the body the player is kicking, there will be a certain probability of scoring a goal.
A simple example would be a static game situation such as a penalty kick. After all, the distance to the goal is always fixed – 11 metres. The goalkeeper also almost always occupies the same position in the centre of the goal. The weather, the foot (left or right) with which the kick is taken, the player’s and goalkeeper’s skill can have a small influence on the probability of scoring a goal. According to statistics, penalties are scored on average 76% of the time. This means that the system will award 0.76xG for such a game moment, regardless of whether a goal is scored or not.
This metric is of great practical importance for making accurate predictions for football matches and is actively used on our website.
2. xGRR (xG Realisation Ratio) is a unique metric developed by our team that shows how ‘fair’ a match result is in terms of the quality of chances created, that is, how effectively the team converts expected goals into actual goals.
Interpretation:
xGRR = 1: Team is scoring exactly as expected
xGRR > 1: Team is overperforming their xG (efficient finishing)
xGRR < 1: Team is underperforming their xG (poor finishing)
3. xG Luck Quotient (xGLQ) is a unique metric developed by our team of analysts to evaluate a team’s luck in a game. For example, if a team takes only 2 shots from midfield in the entire game and scores 2 goals, their final xG will be low. In this case we can talk about the team’s luck. And if the team tried hard, took many shots at the goal and scored only 1 goal, then we can talk about bad luck of the team. xGLQ allows to estimate the numerical value of luck and bad luck of the team.
Interpretation:
xGLQ = 0: Neither lucky nor unlucky in finishing
xGLQ > 0: Positive values indicate fortunate finishing
- Team is overperforming their xG (scoring more than expected)
- +0.1 to +0.5: Slightly lucky finishing
- +0.5 to +1.0: Moderately lucky finishing
- +1.0 to +2.0: Very lucky finishing
- > +2.0: Extremely lucky finishing (unsustainable in the long term)
xGLQ > 0: Negative values indicate unfortunate finishing
- Team is underperforming their xG (scoring less than expected)
- -0.1 to -0.5: Slightly unlucky finishing
- -0.5 to -1.0: Moderately unlucky finishing
- -1.0 to -2.0: Very unlucky finishing
- < -2.0: Extremely unlucky finishing (likely to regress toward the mean)
4. Shot Precision Index (SPI) is a metric that measures the percentage of shots on target, reflecting the quality of shot selection and technical execution. This metric identifies players/teams with disciplined shot selection. Teams with a high SPI percentage are more likely to test the goalkeeper and score.
- High SPI → Prioritizes high-probability shots. Common in possession-based teams (e.g., Manchester City).
- Low SPI → May indicate poor chance creation or decision-making.
5. xG Shot Value Index (xG SVI) is a metric that quantifies the average quality of each shot taken by a team based on expected goals. A high xG SVI means that a team is constantly creating dangerous chances, often finding themselves in positions where the probability of scoring a goal is statistically higher. Conversely, a low SVI indicates that the team is content with low-quality attempts that are less likely to result in goals. This metric is a powerful indicator of a team’s attacking quality and tactical discipline.
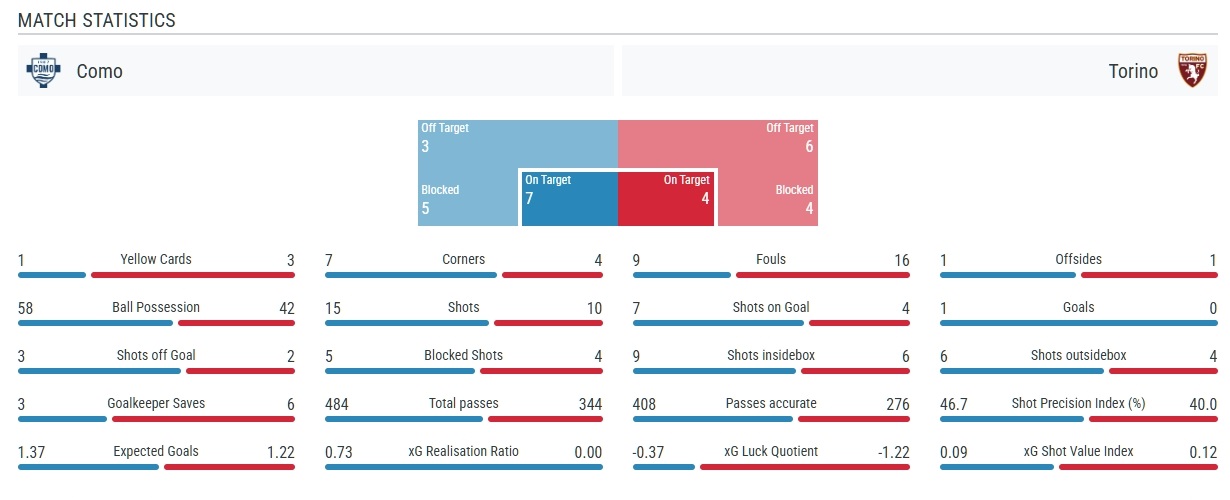
You can find all of these metrics in the match statistics section for each finished match. The figure below shows an example of what the match statistics look like.


